Area, Distance & Drive Time Analysis
UPATED WITH 2021 CENSUS DATA
Analyse areas based on drive time or distance
Area, Distance and Drive Time Reports
Pinpoint Your Perfect Audience
Bulk Purchase reports from as little as £10 per report
Now you can access our powerful drive time, area, and distance demographic reports for as little as £10 each with our new bulk purchase options. Our simple credit system allows you to pre-purchase report credits at a significant discount. Once in your account, these credits are valid for 24 months, letting you quickly order future reports with an easy, online request.
Simply use your credits as needed for any report, making sophisticated demographic analysis both affordable and effortless for your ongoing projects.
What's Included
Our standard report priced at £59 plus vat contains:
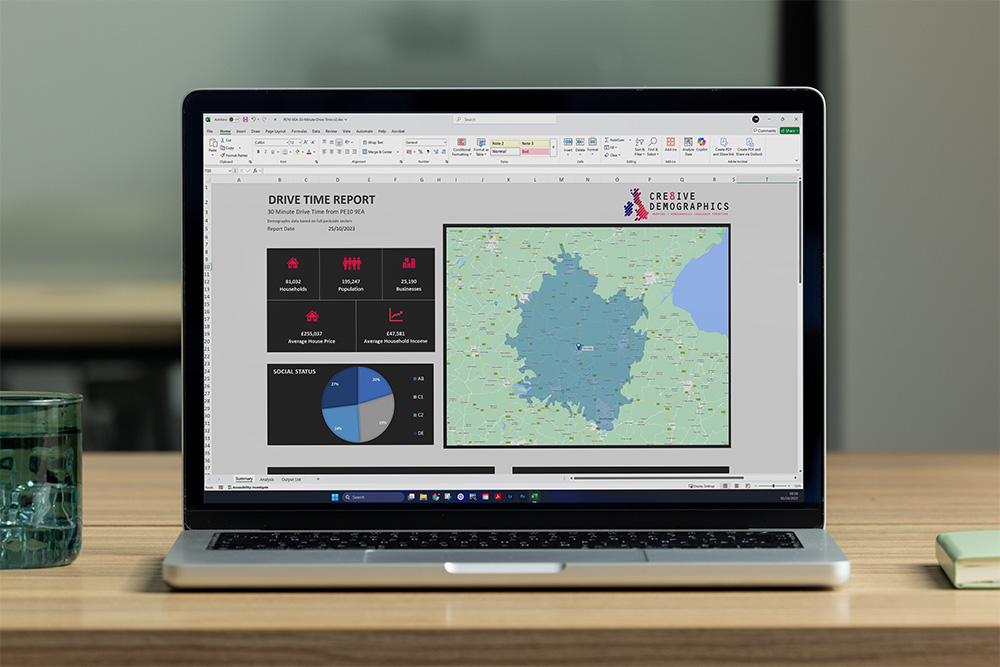
Graphical overview of the area
Area Overview
Our Distance, Drive Time, or Area Overview combines detailed area maps with essential demographic and economic data, providing a powerful tool for location analysis. Instantly visualise your chosen area and access key information such as the total number of households, population size, and average household income.
These insights make it easy to understand the economic profile and potential of any postcode sector, drive time catchment, or custom area boundary.
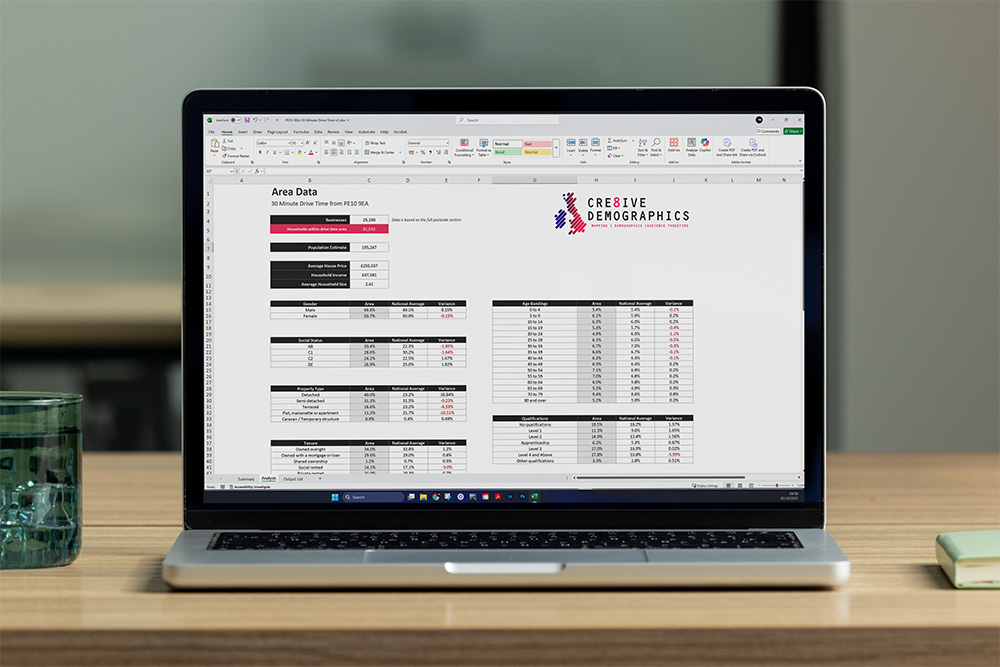
Catchment area demographics with national average comparison
Area Demographic Data
Our area demographic data section provides a comprehensive and detailed analysis of the specified area. This expanded demographic profile covers a wide spectrum of critical variables, including gender distribution, social status, property type, housing tenure, household structure, and marital status. You’ll also gain valuable insights into employment rates, the presence of dependent children, age group breakdowns, educational qualifications, disability prevalence, vehicle ownership, ethnicity, and religious affiliation.
For every data point, our reports include a direct comparison with the national average, allowing you to benchmark local characteristics against broader UK trends. This side-by-side analysis ensures you can quickly identify unique strengths, gaps, or opportunities within your chosen area—empowering smarter decisions for marketing, investment, public services, and strategic planning.
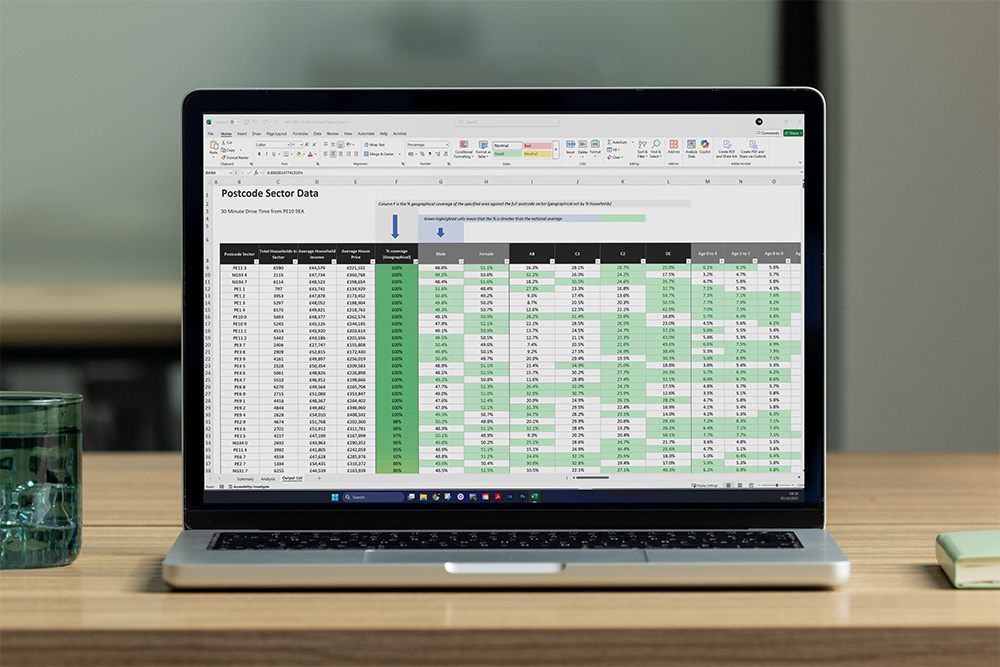
Individual Postcode sector detail
Postcode Sector Breakdown
The postcode sector breakdown section of the report provides a detailed demographic analysis for every postcode sector within your selected catchment area, offering a clear view of local characteristics at a granular level. For each postcode sector, you’ll receive comprehensive data on population, households, income, age distribution, employment, and more—enabling precise comparison and targeted decision-making.
Additionally, the report highlights the exact proportion of each postcode sector that falls within your catchment, giving you an accurate understanding of coverage and helping you identify the areas most relevant to your business, marketing, or investment objectives.
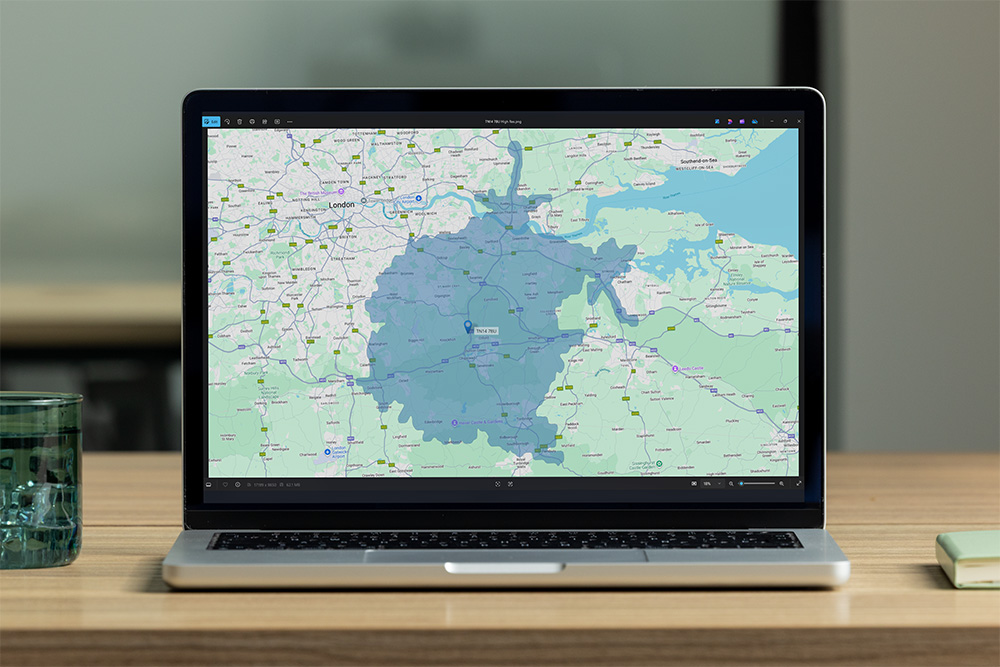
Visualise and import
High Resolution Maps
Each report includes high-resolution map images that visually illustrate your defined catchment area, making it easy to interpret and present your findings with clarity and professionalism. These detailed maps provide a clear overview of the boundaries and key features within your selected region, supporting more effective planning and communication.
For advanced spatial analysis, you can also request .shp (shapefile) files compatible with your own GIS (Geographic Information System) software, allowing you to seamlessly integrate the catchment data into your existing workflows and mapping projects.
This combination of visual and data-driven resources ensures you have everything needed for precise analysis and impactful presentations.